Plot pretty hierarchical clustering dendrograms.
plot_hclust.RdRun hierarchical clustering on the given data matrix and plot the resulting dendrogram using a pretty theme. Also allows for coloring of the leaf nodes.
plot_hclust(
  data,
  leaf_labels = rownames(data),
  leaf_colors = NULL,
  dist_metric = "euclidean",
  dist_matrix = NULL,
  linkage = "ward.D",
  text_size = 10,
  title = NULL,
  show_plot = F
)
Arguments
- data
Data matrix or data.frame on which to perform hierarchical clustering.
- leaf_labels
(Optional) Text labels for leaf nodes (e.g., class/outcome labels).
- leaf_colors
(Optional) Data vector to use for coloring leaf nodes.
- dist_metric
Distance metric for clustering (see [stats::dist()]).
- dist_matrix
(Optional) Distance matrix for clustering. Must provide either
dist_metricordist_matrix.- linkage
Rype of linkage for hierarchical clustering (see [stats::hclust()]).
- text_size
Numeric; size of text for leaf node labels.
- title
Character string. Title of plot.
- show_plot
Logical. Should this plot be printed? Default
FALSE.
Value
A list of three:
- plot
A ggplot object of the dendrogram.
- hclust
Output of [stats::hclust()]
- dend
Hierarchical clustering dendrogram data. See output of [ggdendro::dendro_data()].
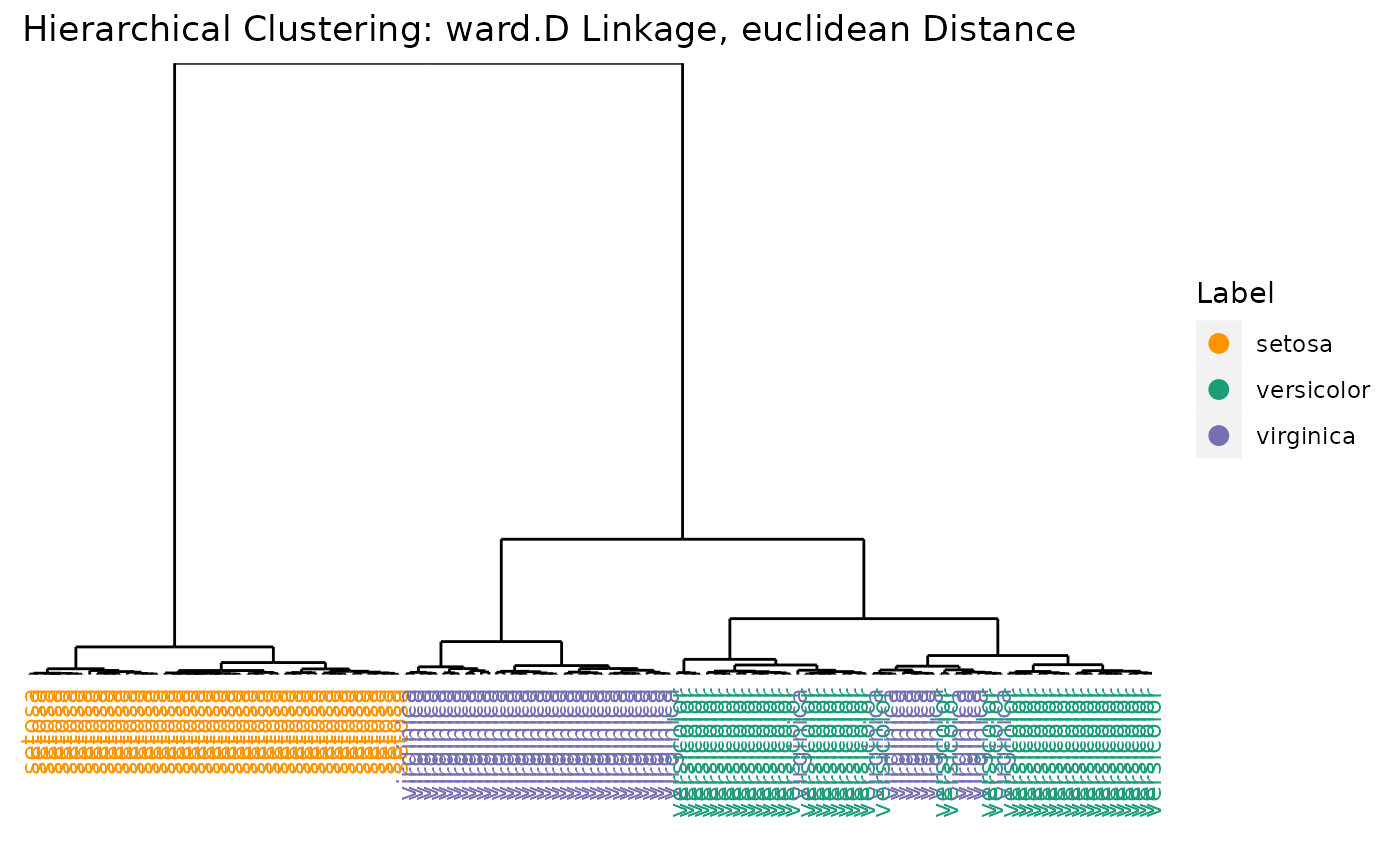
Examples
out <- plot_hclust(data = iris[, -5], leaf_labels = iris$Species,
                  leaf_colors = iris$Species)
out$plot