Plot horizontal dot plot.
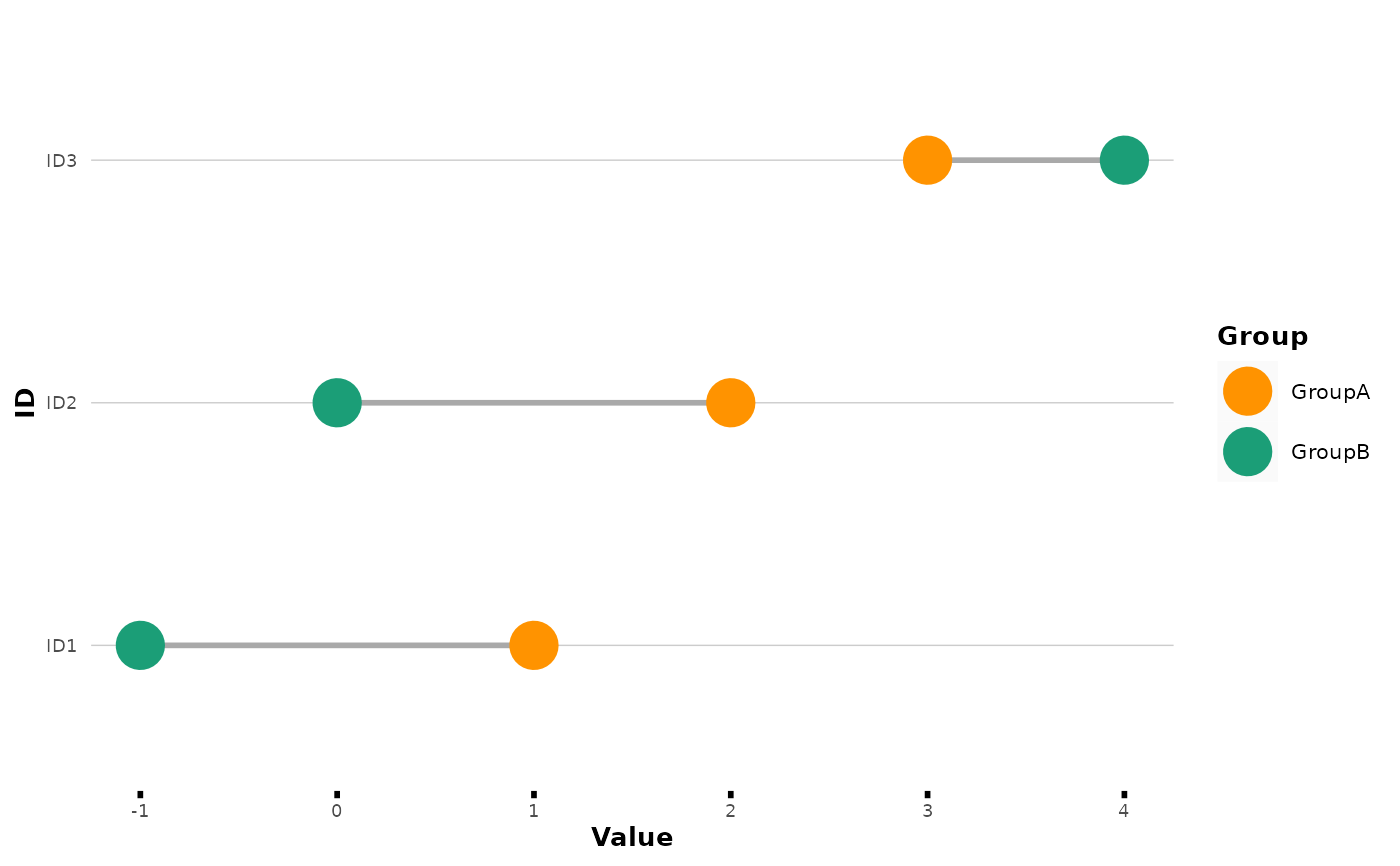
plot_horizontal_dotplot.RdCreates a horizontal dot plot using custom ggplot theme, as an alternative to grouped bar charts.
plot_horizontal_dotplot(
  data,
  x_str,
  y_str,
  color_str = NULL,
  line_size = 1,
  line_color = "darkgray",
  point_size = 8,
  theme_options = NULL,
  show_plot = FALSE,
  ...
)
Arguments
- data
Data frame to use for plot.
- x_str
Character string. Name of variable in
datato plot on x-axis.- y_str
Character string. Name of variable in
datato plot on y-axis.- color_str
Character string (optional). Name of variable in
datato use as color aesthetic in plot.- line_size
Size of line, representing range of values.
- line_color
Color of line, representing range of values.
- point_size
Size of point.
- theme_options
(Optional) list of arguments to pass to vthemes::theme_vmodern().
- show_plot
Logical. Should this plot be printed? Default
FALSE.- ...
Other arguments to pass to [ggplot2::geom_point()].
Value
A ggplot object