Plot pretty pair plots using custom ggplot theme.
plot_pairs.RdPlots pretty pair plots using a custom ggplot theme and provides additional functionality beyond [GGally::ggpairs()] such as the ability to add two different color schemes (one for the lower triangular subpanels and another for the upper triangular subpanels).
plot_pairs(
  data,
  columns,
  color = NULL,
  color_upper = NULL,
  color_label = "",
  color_upper_label = "",
  color_scheme = NULL,
  color_scheme_upper = NULL,
  column_labels = NULL,
  title = "",
  point_size = 0.5,
  point_alpha = 0.5,
  cor_text_size = 3.5,
  subsample = 1,
  show_upper = TRUE,
  drop = TRUE,
  theme_function = NULL,
  show_plot = FALSE,
  ...
)
Arguments
- data
Data frame to use for plot.
- columns
Vector of column indicies or column names to plot.
- color
(Optional) Data vector to use as colors for lower ggplot panels.
- color_upper
(Optional) Data vector to use as colors for upper ggplot panels.
- color_label
Character string. Label for color legend title (used in lower ggplot panels).
- color_upper_label
Character string for color_upper legend title (used in upper ggplot panels).
- color_scheme
(Optional) Vector of colors to set manual color scheme corresponding to color_lower argument (i.e., the color scheme in the lower panels). If
NULL(default), viridis color scheme is used.- color_scheme_upper
(Optional) Vector of colors to set manual color scheme corresponding to color_upper argument (i.e., the color scheme in the upper panels). If
NULL(default), viridis color scheme is used.- column_labels
Label names to be displayed on strips.
- title
Character string. Title of plot.
- point_size
Point size for [ggplot2::geom_point()].
- point_alpha
Alpha value for [ggplot2::geom_point()].
- cor_text_size
Size of correlation text.
- subsample
Proportion of rows to subsample and plot.
- show_upper
Logical. Should we show subplots in upper panels?
- drop
Logical. Whether or not to drop factors with no observations.
- theme_function
function which adds theme() to ggpairs() object. If
NULL, addvthemes::theme_vmodern()to [GGally::ggpairs()] object.- show_plot
Logical. Should this plot be printed? Default
FALSE.- ...
Other arguments to pass to
vthemes::theme_vmodern()ortheme_function()
Value
A [GGally::ggpairs] object.
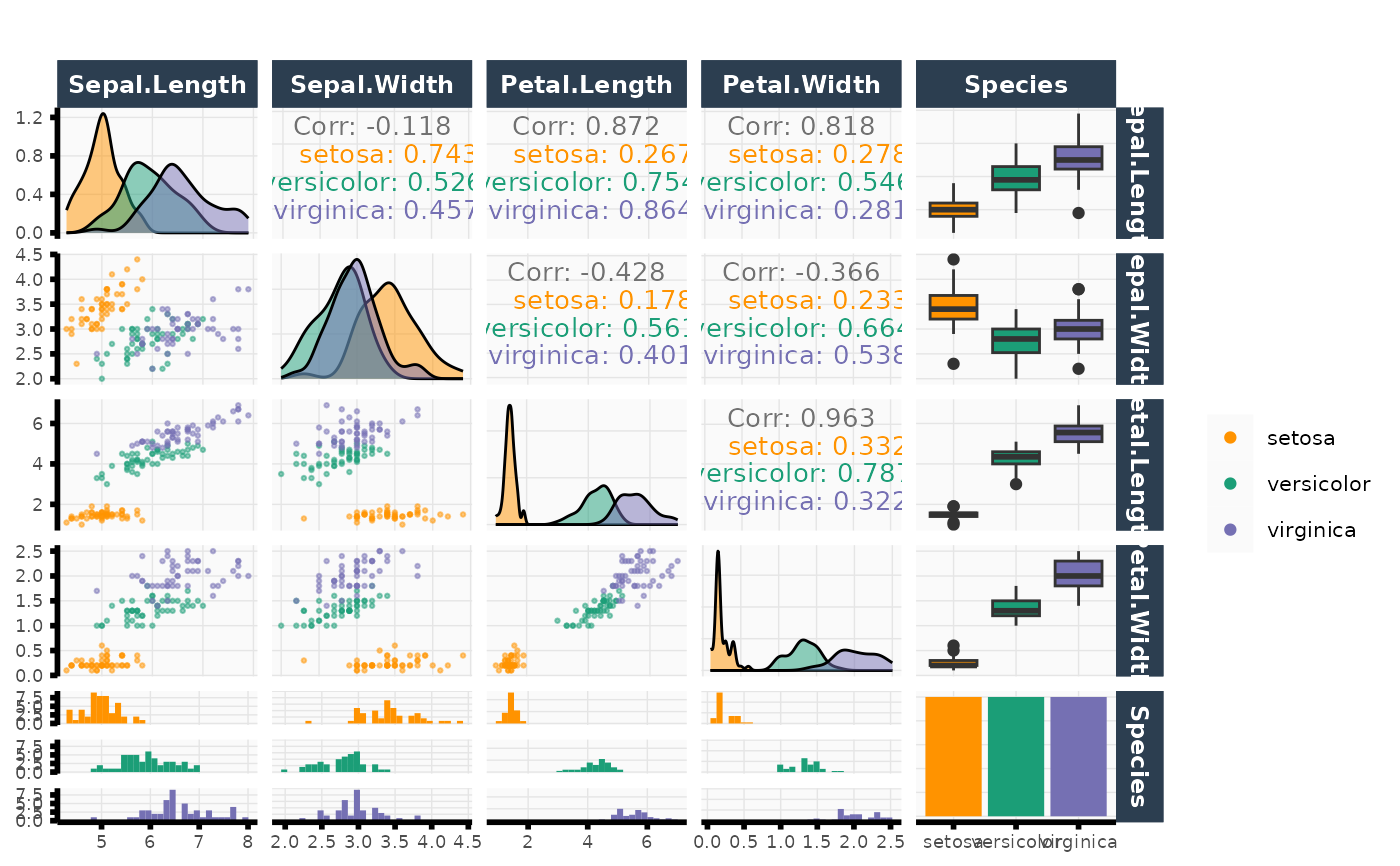
Examples
plot_pairs(data = iris, columns = 1:ncol(iris), color = iris$Species)
#> Registered S3 method overwritten by 'GGally':
#>   method from
#>   +.gg   ggplot2
#> `stat_bin()` using `bins = 30`. Pick better value with `binwidth`.
#> `stat_bin()` using `bins = 30`. Pick better value with `binwidth`.
#> `stat_bin()` using `bins = 30`. Pick better value with `binwidth`.
#> `stat_bin()` using `bins = 30`. Pick better value with `binwidth`.