Plot pretty PCA plots using custom ggplot theme.
plot_pca.RdRun PCA on the given data matrix and generates PC plots for the specified principal components.
plot_pca(
  X,
  pca_obj,
  npcs,
  pcs,
  color = NULL,
  color_upper = NULL,
  color_label = "",
  color_upper_label = "",
  color_scheme = NULL,
  color_scheme_upper = NULL,
  point_size = 0.5,
  point_alpha = 1,
  subsample = 1,
  show_var = TRUE,
  center = TRUE,
  scale = FALSE,
  title = "",
  show_plot = FALSE,
  ...
)
Arguments
- X
Data matrix or data.frame on which to perform PCA. Must specify either
Xorpca_obj.- pca_obj
Output of previous run of plot_pca() to avoid re-computing SVDs (i.e., the PC loadings and scores) again. Must specify either
Xorpca_obj. Ignored ifXis provided.- npcs
Number of top PCs to plot. Must specify either
npcsorpcs.- pcs
Vector of which PCs to show. Must specify either
npcsorpcs. Ignored ifnpcsis provided.- color
(Optional) Data vector to use as colors for lower ggplot panels.
- color_upper
(Optional) Data vector to use as colors for upper ggplot panels.
- color_label
Character string. Label for color legend title (used in lower ggplot panels).
- color_upper_label
Character string for color_upper legend title (used in upper ggplot panels).
- color_scheme
(Optional) Vector of colors to set manual color scheme corresponding to color_lower argument (i.e., the color scheme in the lower panels). If
NULL(default), viridis color scheme is used.- color_scheme_upper
(Optional) Vector of colors to set manual color scheme corresponding to color_upper argument (i.e., the color scheme in the upper panels). If
NULL(default), viridis color scheme is used.- point_size
Point size for [ggplot2::geom_point()].
- point_alpha
Alpha value for [ggplot2::geom_point()].
- subsample
Proportion of rows to subsample and plot.
- show_var
Logical. Whether or not to show the proportion of variance explained in axes labels.
- center
Logical. Whether or not to center data for PCA.
- scale
Logical. Whether or not to scale data for PCA.
- title
Character string. Title of plot.
- show_plot
Logical. Should this plot be printed? Default
FALSE.- ...
Other arguments to pass to
vthemes::theme_vmodern()ortheme_function()
Value
A list of four:
- plot
A ggplot object of the PC pair plots.
- scores
A matrix with the PC scores.
- loadings
A matrix with the PC loadings.
- var.explained
A vector of the proportions of variance explained.
Examples
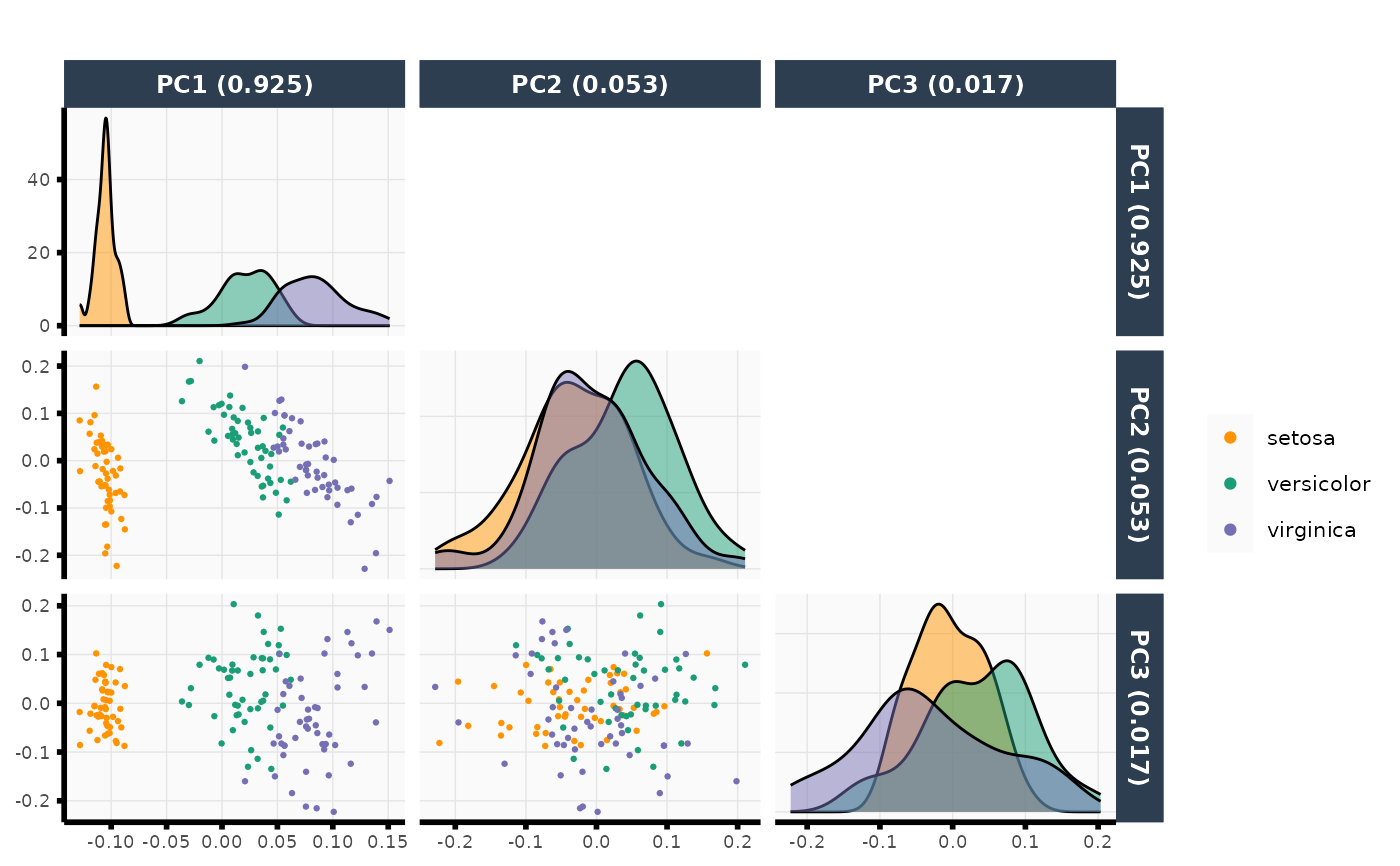
out <- plot_pca(X = iris[, -5], npcs = 3, color = iris$Species)
out$plot
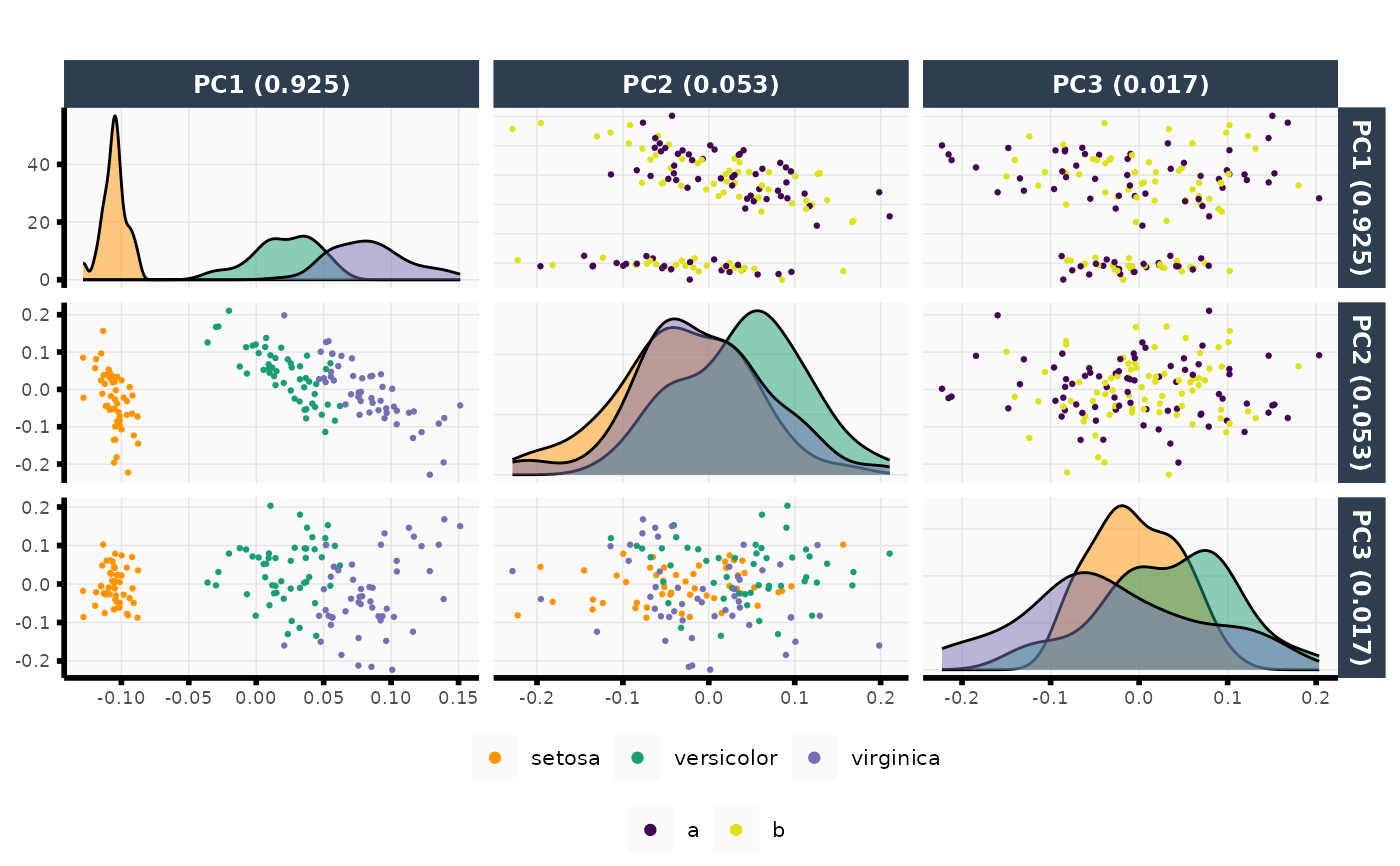
 iris2 <- data.frame(iris, z = rep(letters[1:2], length.out = nrow(iris)))
out <- plot_pca(X = iris2[, -c(5, 6)], npcs = 3,
color = iris2$Species, color_upper = as.factor(iris2$z))
out$plot
iris2 <- data.frame(iris, z = rep(letters[1:2], length.out = nrow(iris)))
out <- plot_pca(X = iris2[, -c(5, 6)], npcs = 3,
color = iris2$Species, color_upper = as.factor(iris2$z))
out$plot