Plot pretty boxplots using custom ggplot theme.
plot_boxplot.RdWrapper around [ggplot2::geom_boxplot()] that plots pretty boxplots using a custom ggplot theme.
plot_boxplot(
  data,
  x_str = NULL,
  y_str = NULL,
  fill_str = NULL,
  horizontal = FALSE,
  theme_options = NULL,
  show_plot = FALSE,
  ...
)
Arguments
- data
Data frame to use for plot.
- x_str
Character string. Name of variable in
datato plot on x-axis. IfNULL, plot boxplot using all values in data frame.- y_str
Character string (optional). Name of variable in
datato plot on y-axis. Should be a factor variable.- fill_str
Character string (optional). Name of variable in
datato use as fill aesthetic in plot.- horizontal
Logical. Whether the boxplots should be horizontal instead of vertical.
- theme_options
(Optional) list of arguments to pass to vthemes::theme_vmodern().
- show_plot
Logical. Should this plot be printed? Default
FALSE.- ...
Other arguments to pass to [ggplot2::geom_boxplot()].
Value
A ggplot boxplot.
See also
Other pretty_ggplot_wrappers:
plot_bar(),
plot_density(),
plot_histogram(),
plot_line(),
plot_point()
Examples
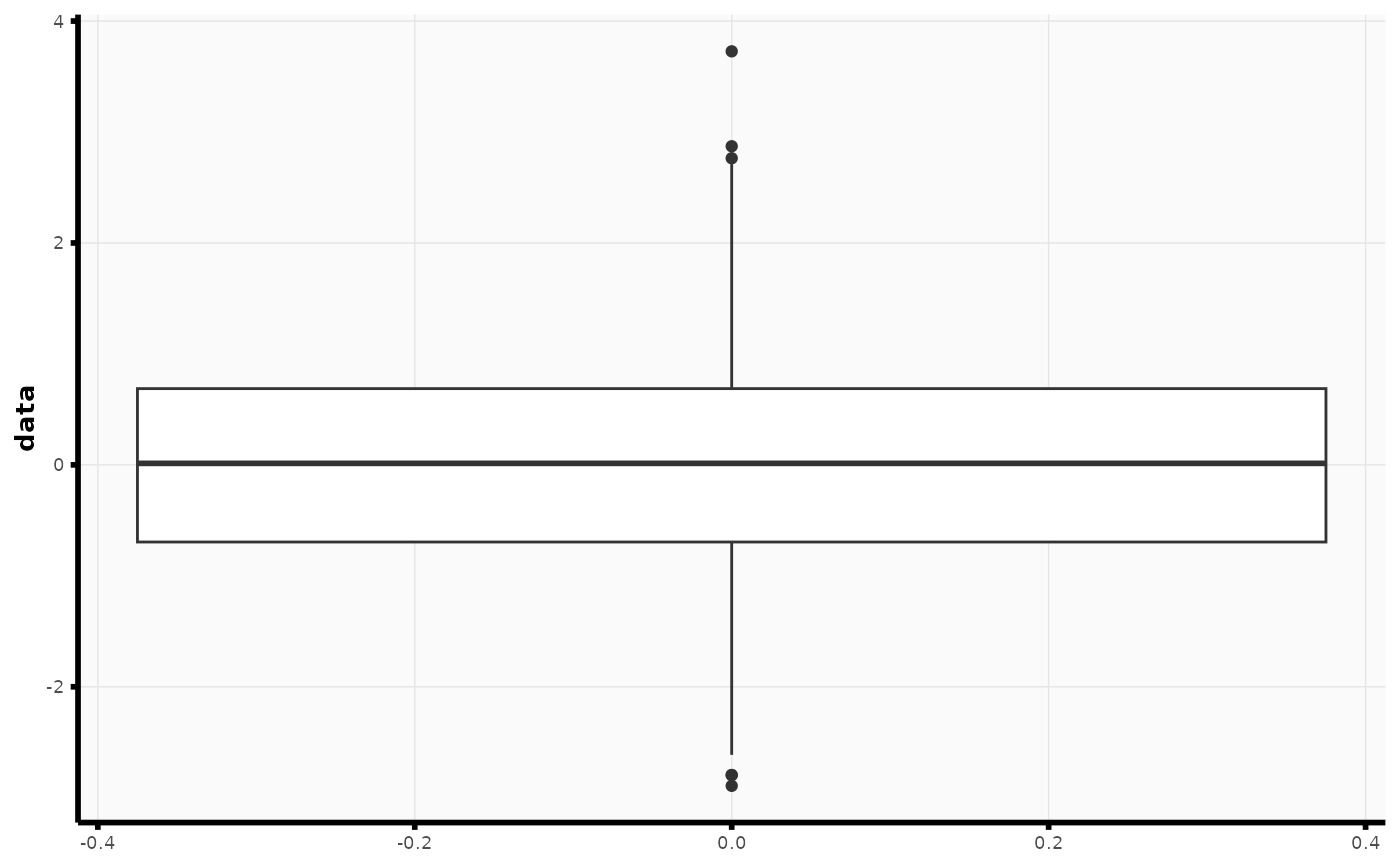
## plot boxplot of all data in data frame
plot_boxplot(as.data.frame(matrix(rnorm(1000), nrow = 100)))
 ## plot boxplot of single column in data frame
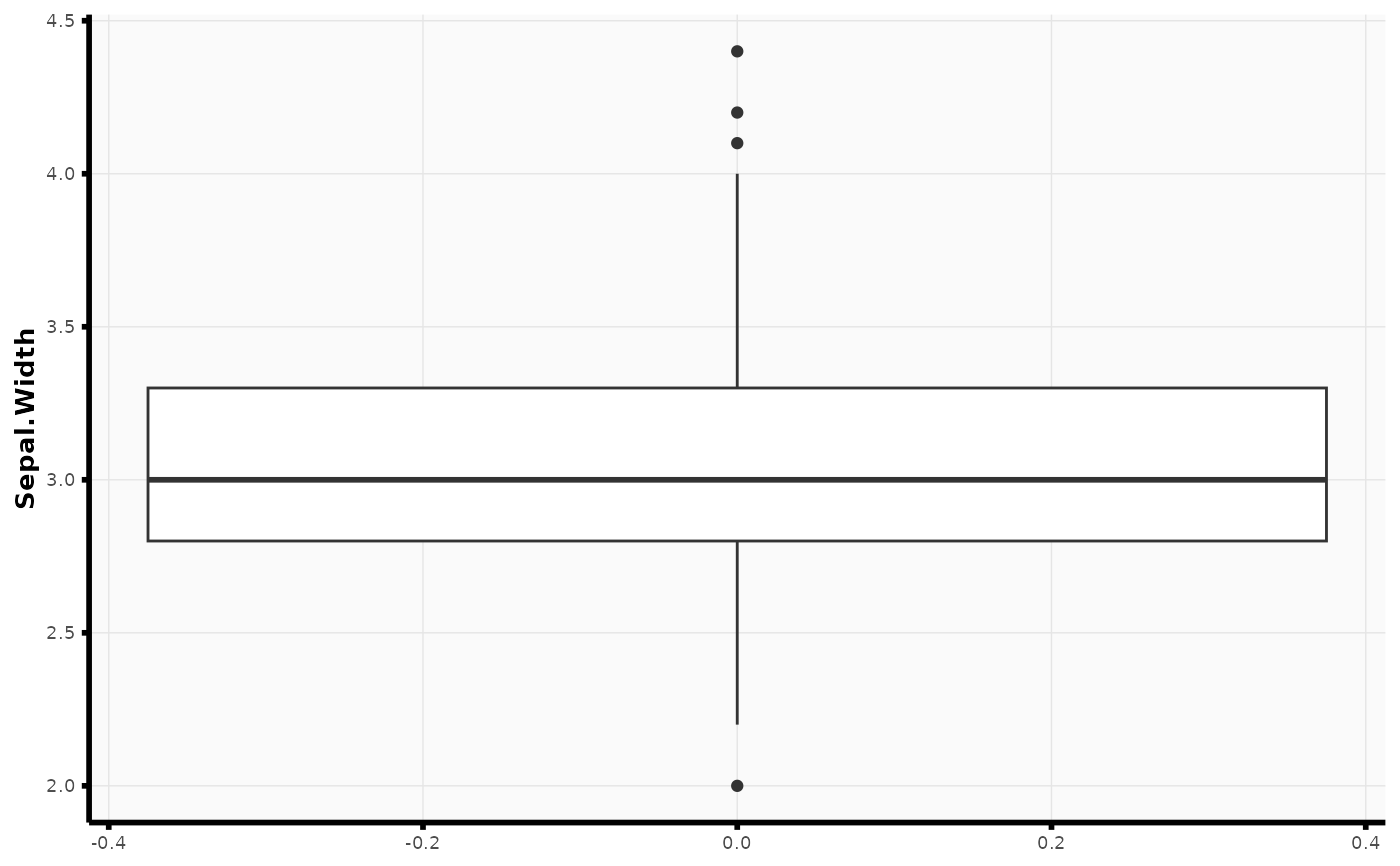
plot_boxplot(iris, y_str = "Sepal.Width")
## plot boxplot of single column in data frame
plot_boxplot(iris, y_str = "Sepal.Width")
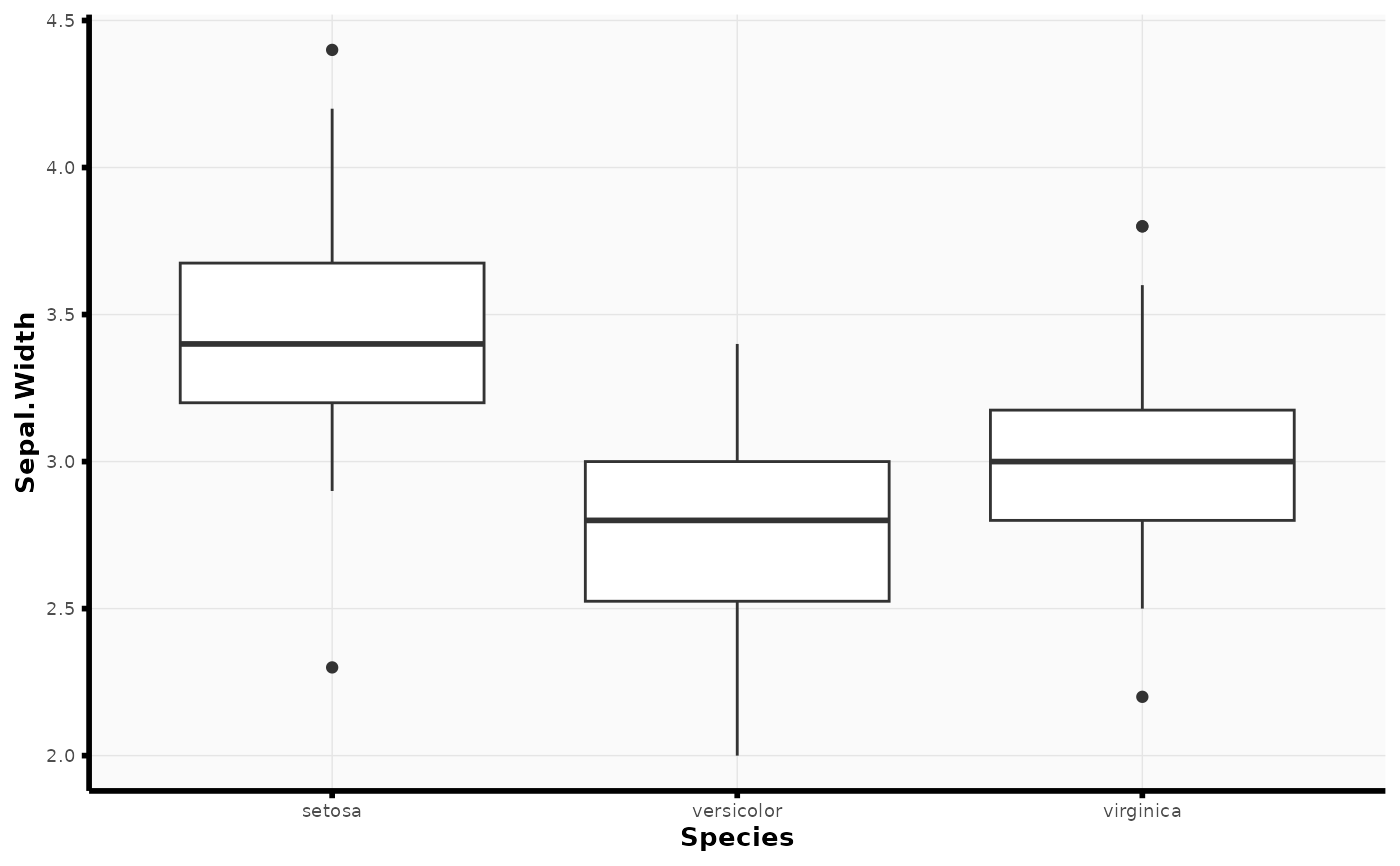
 plot_boxplot(iris, x_str = "Species", y_str = "Sepal.Width")
 iris2 <- data.frame(iris,
z = as.factor(rep(letters[1:2],
length.out = nrow(iris))))
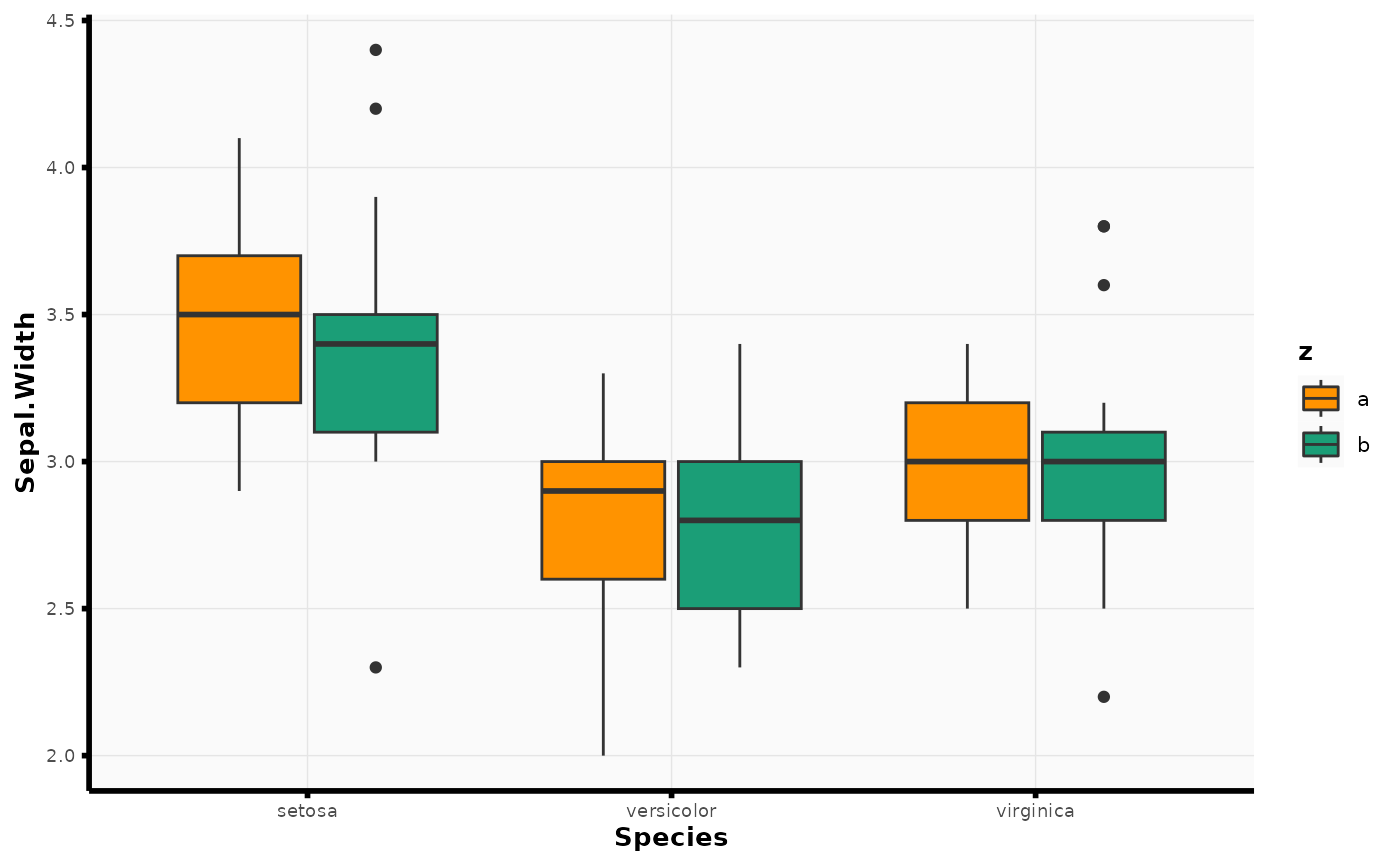
plot_boxplot(iris2, x_str = "Species", y_str = "Sepal.Width", fill_str = "z")
iris2 <- data.frame(iris,
z = as.factor(rep(letters[1:2],
length.out = nrow(iris))))
plot_boxplot(iris2, x_str = "Species", y_str = "Sepal.Width", fill_str = "z")
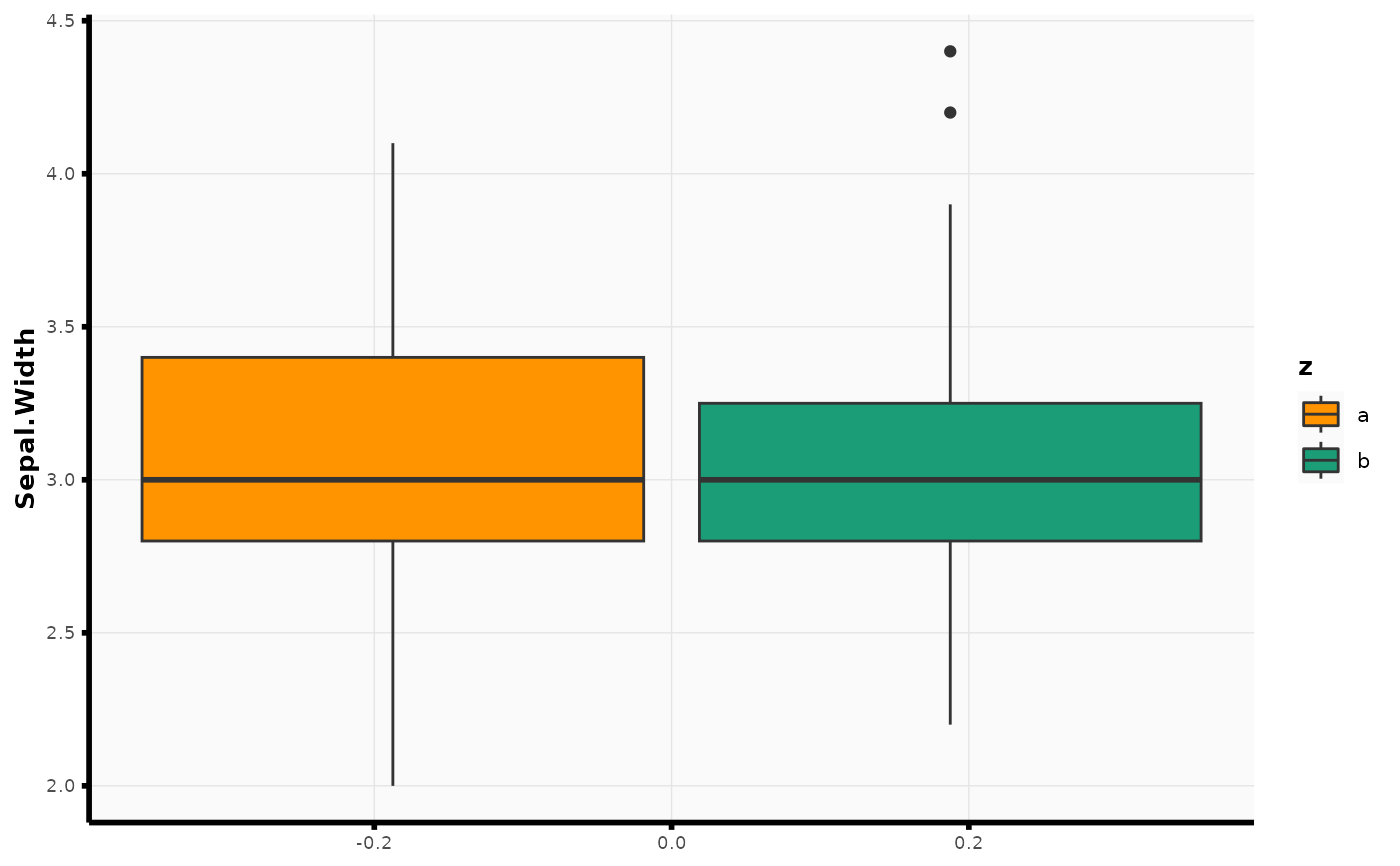
 plot_boxplot(iris2, y_str = "Sepal.Width", fill_str = "z")