Plot pretty kernel density plots using custom ggplot theme.
plot_density.RdWrapper around [ggplot2::geom_density()] that plots pretty density plots using a custom ggplot theme.
plot_density(
  data,
  x_str = NULL,
  fill_str = NULL,
  fill = "#6FBBE3",
  alpha = 0.4,
  theme_options = NULL,
  show_plot = FALSE,
  ...
)
Arguments
- data
Data frame to use for plot.
- x_str
Character string. Name of variable in
datato plot on x-axis. IfNULL, plot density using all values in data frame.- fill_str
Character string (optional). Name of variable in
datato use as fill aesthetic in plot.- fill
Fill color. Used only if
fill_strisNULL.- alpha
Alpha value for transparency.
- theme_options
(Optional) list of arguments to pass to vthemes::theme_vmodern().
- show_plot
Logical. Should this plot be printed? Default
FALSE.- ...
Other arguments to pass to [ggplot2::geom_density()].
Value
A ggplot density.
See also
Other pretty_ggplot_wrappers:
plot_bar(),
plot_boxplot(),
plot_histogram(),
plot_line(),
plot_point()
Examples
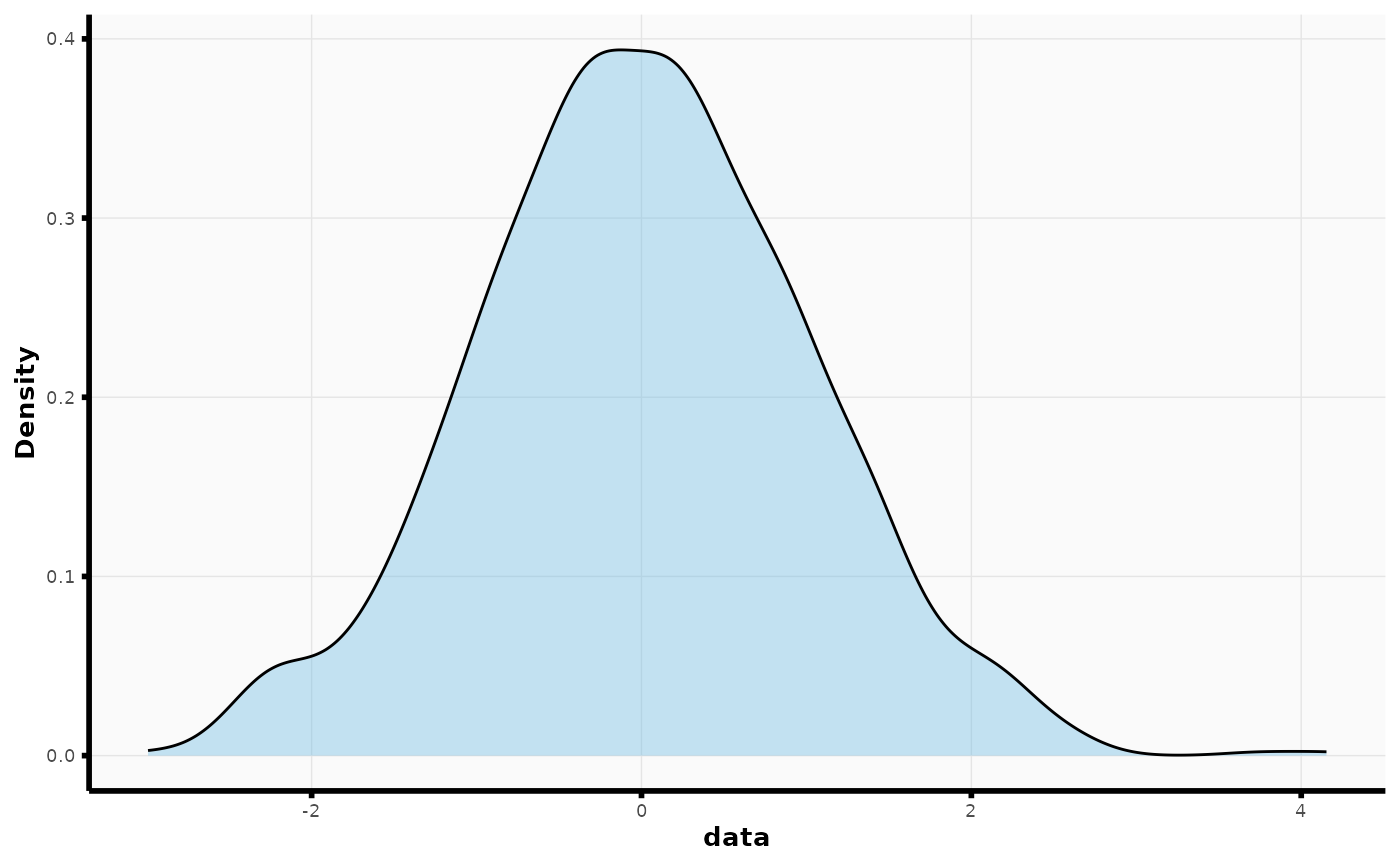
## plot distribution of all data in data frame
plot_density(as.data.frame(rnorm(1000), nrow = 100))
 ## plot distribution of a single column in data frame
plot_density(iris, x_str = "Sepal.Width")
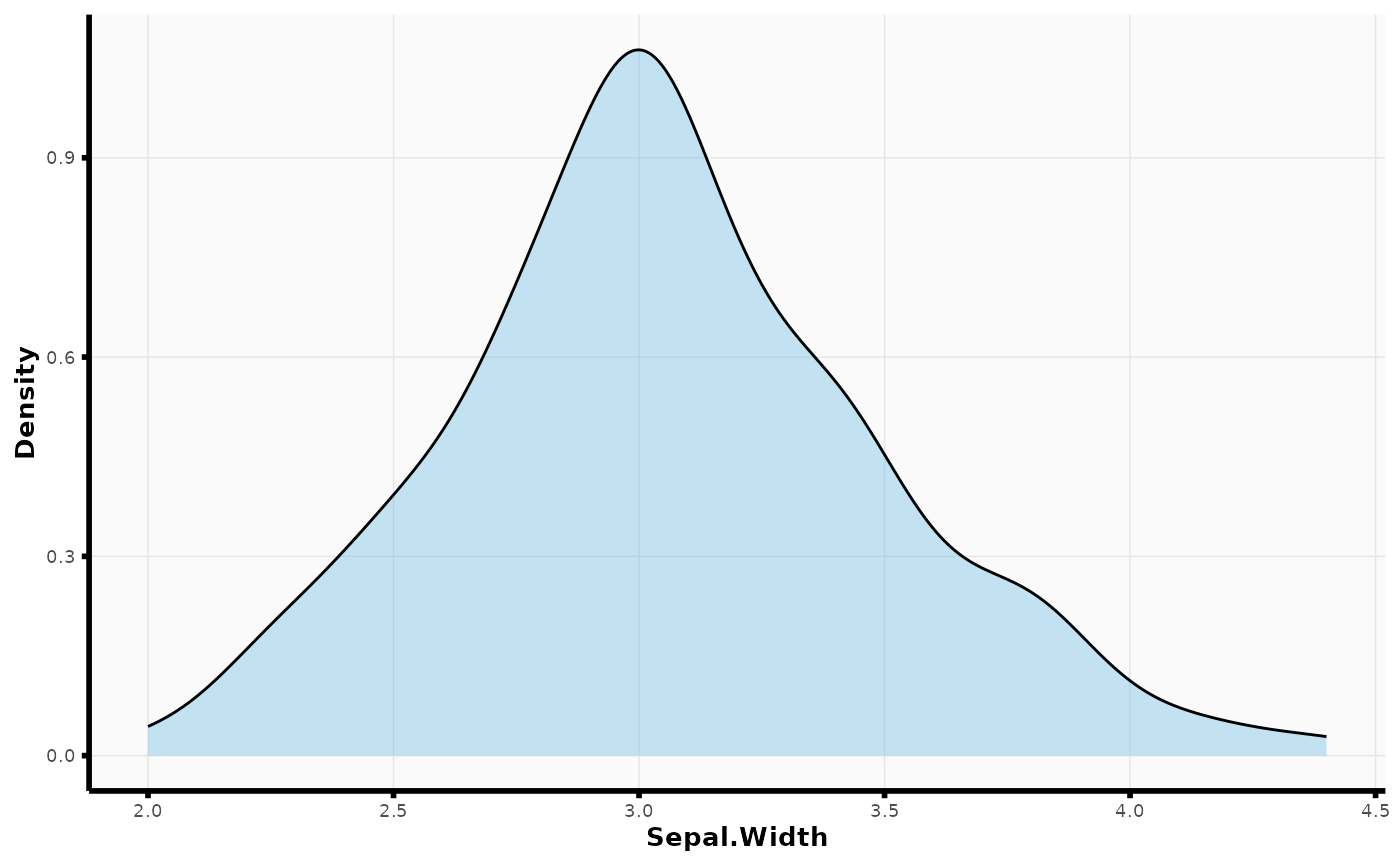
## plot distribution of a single column in data frame
plot_density(iris, x_str = "Sepal.Width")
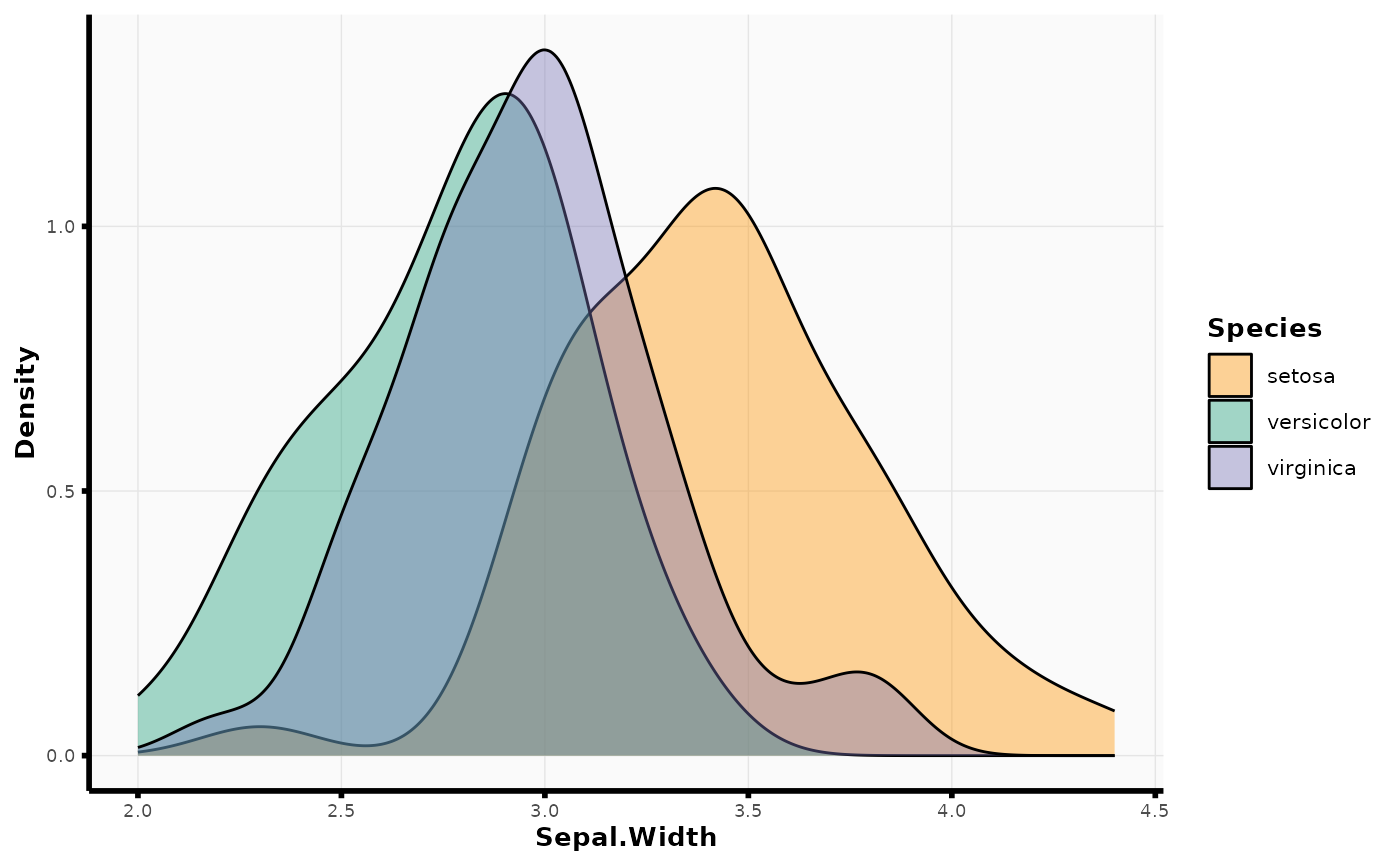
 plot_density(iris, x_str = "Sepal.Width", fill_str = "Species")