Overview
The goal of simChef is to help you quickly cook up a fully-realized, high-quality, reproducible, and transparently-documented simulation study in a flexible, efficient, and low-code manner. simChef removes many of the administrative burdens of simulation design through:
- An intuitive tidy grammar of data science simulations
- Powerful abstractions for distributed simulation processing backed by
future - Automated generation of interactive R Markdown simulation documentation, situating results next to the workflows needed to reproduce them.
Installation
simChef is under active development. To install the package directly from GitHub, please use:
devtools::install_github("Yu-Group/simChef")Example Usage
Consider the following toy simulation experiment, where we want to study the prediction accuracy of linear regression and random forests under both linear and non-linear data-generating processes for varying signal-to-noise ratios.
Let us first code up the necessary simulation components, namely, the linear and nonlinear (here, an exclusive-or) data-generating processes as well as the linear regression and random forest models. To evaluate the methods and visualize the results, one can also write custom code, but we will leverage built-in evaluation and visualization functions (e.g., summarize_pred_err and plot_pred_err) from simChef for convenience.
# Generate data via linear model
linear_dgp_fun <- function(n_train, n_test, p, beta, noise_sd) {
  n <- n_train + n_test
  X <- matrix(rnorm(n * p), nrow = n, ncol = p)
  y <- X %*% beta + rnorm(n, sd = noise_sd)
  data_list <- list(
    X_train = X[1:n_train, , drop = FALSE],
    y_train = y[1:n_train],
    X_test = X[(n_train + 1):n, , drop = FALSE],
    y_test = y[(n_train + 1):n]
  )
  return(data_list)
}

# Generate data via exclusive-or model
xor_dgp_fun <- function(n_train, n_test, p, thresh, beta, noise_sd) {
  n <- n_train + n_test
  X <- matrix(rnorm(n * p), nrow = n, ncol = p)
  xor <- (((X[, 1] > thresh) + (X[, 2] > thresh)) == 1)
  y <- beta * xor + rnorm(n, sd = noise_sd)
  data_list <- list(
    X_train = X[1:n_train, , drop = FALSE],
    y_train = y[1:n_train],
    X_test = X[(n_train + 1):n, , drop = FALSE],
    y_test = y[(n_train + 1):n]
  )
  return(data_list)
}

# Fit linear regression model
linear_reg_fun <- function(X_train, y_train, X_test, y_test) {
  train_df <- dplyr::bind_cols(data.frame(X_train), y = y_train)
  fit <- lm(y ~ ., data = train_df)
  predictions <- predict(fit, data.frame(X_test))
  return(list(predictions = predictions, y_test = y_test))
}

# Fit random forest model
rf_fun <- function(X_train, y_train, X_test, y_test, ...) {
  train_df <- dplyr::bind_cols(data.frame(X_train), y = y_train)
  fit <- ranger::ranger(y ~ ., data = train_df, ...)
  predictions <- predict(fit, data.frame(X_test))$predictions
  return(list(predictions = predictions, y_test = y_test))
}
From here, there is minimal coding on the user’s end, as simChef provides a powerful tidy grammar to instantiate, assemble, and run various configurations of the simulation experiment.
library(simChef)

# Uncomment to run experiment across multiple processors
# library(future)
# plan(multisession, workers = 5)

# Create `simChef` DGPs (data-generating processes)
linear_dgp <- create_dgp(
  .dgp_fun = linear_dgp_fun, .name = "Linear DGP",
  # additional named parameters to pass to .dgp_fun()
  n_train = 200, n_test = 200, p = 2, beta = c(1, 0), noise_sd = 1
)
xor_dgp <- create_dgp(
  .dgp_fun = xor_dgp_fun, .name = "XOR DGP",
  # additional named parameters to pass to .dgp_fun()
  n_train = 200, n_test = 200, p = 2, thresh = 0, beta = 1, noise_sd = 1
)

# Create `simChef` Methods
linear_reg <- create_method(
  .method_fun = linear_reg_fun, .name = "Linear Regression"
  # additional named parameters to pass to .method_fun()
)
rf <- create_method(
  .method_fun = rf_fun, .name = "Random Forest",
  # additional named parameters to pass to .method_fun()
  num.threads = 1
)

# Create `simChef` Evaluators
pred_err <- create_evaluator(
  .eval_fun = summarize_pred_err, .name = 'Prediction Accuracy',
  # additional named parameters to pass to .eval_fun()
  truth_col = "y_test", estimate_col = "predictions"
)

# Create `simChef` Visualizers
pred_err_plot <- create_visualizer(
  .viz_fun = plot_pred_err, .name = 'Prediction Accuracy Plot',
  # additional named parameters to pass to .viz_fun()
  eval_name = 'Prediction Accuracy'
)

# Create experiment
experiment <- create_experiment(name = "Test Experiment") %>%
  add_dgp(linear_dgp) %>%
  add_dgp(xor_dgp) %>%
  add_method(linear_reg) %>%
  add_method(rf) %>%
  add_evaluator(pred_err) %>%
  add_visualizer(pred_err_plot) %>%
  # vary across noise parameter in linear dgp
  add_vary_across(
    .dgp = "Linear DGP",
    noise_sd = c(0.1, 0.5, 1, 2)
  ) %>%
  # vary across noise parameter in xor dgp
  add_vary_across(
    .dgp = "XOR DGP",
    noise_sd = c(0.1, 0.5, 1, 2)
  )

# Run experiment over n_reps
results <- run_experiment(experiment, n_reps = 100, save = TRUE)

# Render automated documentation and view results
render_docs(experiment)
Simulation experiment complete!
In addition, the code, narrative, and results of the simulation experiment have been automatically rendered into an interactive html document via R Markdown (see ? render_docs), such as the one shown below:
For a more detailed walkthrough of this example usage, please see vignette("simChef").
For an example real-world case study using simChef to develop novel statistical methodology, please check out Boileau et al.. The corresponding interactive R Markdown documentation can be found here.
More examples of the rendered documentation for different simulation experiments: - Toy Example 1 - Toy Example 2
Grammar of a simChef Simulation Experiment
The simChef API distills a simulation experiment into four modular concepts, two of which are optional (but highly recommended): data-generating processes (DGPs), methods, evaluation (optional), and visualization (optional). simChef takes an object-oriented approach to encapsulate these simulation concepts, using R6 classes to make them concrete. These four classes are:
-
DGP: corresponds to the data-generating process from which to generate data.- DGPs simply generate data in a reproducible and flexible manner, in the size and manner that you specify. For a library of preset but highly customizable DGPs,
simChefhas a sibling R package,dgpoix(currently in early development). - Ex: In the above example usage, there are two DGPs: the linear DGP and the exclusive-or DGP.
- DGPs simply generate data in a reproducible and flexible manner, in the size and manner that you specify. For a library of preset but highly customizable DGPs,
-
Method: corresponds to the method (or model) to fit to the data in the experiment.- Methods can be either a new method under study, a baseline comparison method, or any means by which to transform the simulated data (i.e,. the output of DGP).
- Ex: In the above example usage, there are two methods: linear regression and random forests.
-
Evaluator: corresponds to the evaluation metrics/functions to evaluate the methods’ performance.- Evaluators receive the results of the fitted methods and summarize them to produce meaningful statistics about the experiment.
- Ex: In the above example usage, there is one evaluation function that evaluates the test prediction accuracy.
-
Visualizer: corresponds to the visualization tools/functions to visualize results.- These visualizations can be applied directly to the raw method outputs, the evaluation transformations/summaries, or both. Visualizers can output anything that can be rendered in an R Markdown document: static or interactive plots, tables, strings and captured output, markdown, generic HTML, etc.
- Ex: In the above example usage, there is one visualization function that visualizes the test prediction accuracy, averaged across experimental replicates.
A fifth R6 class and concept, Experiment, unites the four concepts above. More precisely, an Experiment is a collection of DGP(s), Method(s), Evaluator(s), and Visualizer(s), which are thoughtfully composed to answer a particular question of interest. An Experiment can also include references to DGP and/or Method parameters that should be varied and combined during the simulation run (see ? add_vary_across).
Using the DGP, Method, Evaluator, and Visualizer classes, users can easily build a simChef Experiment using reusable building blocks and customizable functions.
Once an Experiment has been constructed, users can finally run the simulation experiment via the function run_experiment(). As summarized in the figure below, running the experiment will (1) fit each Method on each DGP (and for each of the varying parameter configurations), (2) evaluate the experiment according to the given Evaluator(s), and (3) visualize the experiment according to the given Visualizer(s).
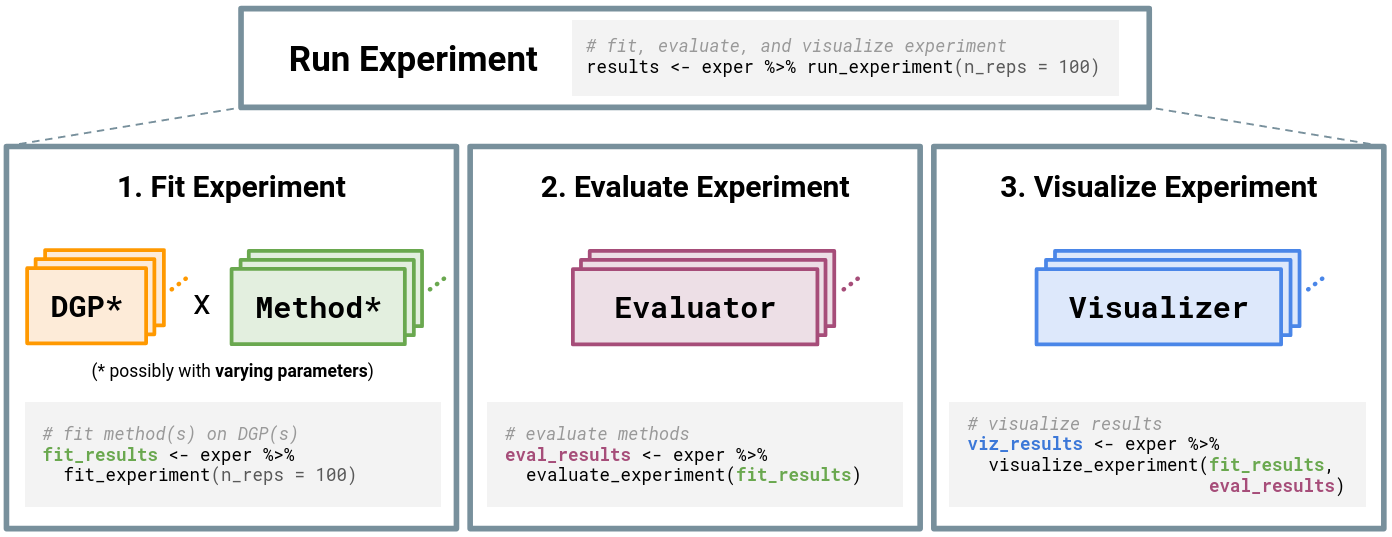
simChef Experiment. The Experiment class handles relationships among the four classes: DGP, Method, Evaluator, and Visualizer. Experiments may have multiple DGPs and Methods, which are combined across the Cartesian product of their varying parameters (represented by \*). Once computed, each Evaluator and Visualizer takes in the fitted simulation replicates, while Visualizer additionally receives evaluation summaries.Origins of simChef
Towards veridical data science
In their 2020 paper “Veridical Data Science”, Yu and Kumbier propose the predictability, computability, and stability (PCS) framework, a workflow and documentation for “responsible, reliable, reproducible, and transparent results across the data science life cycle”. Under the umbrella of the PCS framework, we began the process of deriving a set of guidelines tailored specifically for simulation studies, inspired by both high-quality simulation studies from the literature and our own simulations to examine the statistical properties of methods within the PCS framework.
While creating our own simulations, we soon found that no existing R package could fully satisfy our developing requirements. What began as a toolbox for our own simulations becamesimChef. We believe these tools will be useful for anyone intending to create their own simulation studies in R.
Thinking like a chef
The development of simChef has been guided by our love of… cooking? Perhaps surprisingly, we found that cooking serves as useful analogy for the process of creating a simulation study. For the aspiring chefs, consider the following components of a high-quality meal:
-
Nutritious and delicious ingredients – All good meals start with good ingredients, and the same is true of simulation experiments. If realistic simulation data (entirely synthetic or driven by real-world data) is not available, then there is no hope of producing high-quality simulations. Creating realistic synthetic data is the primary goal of our sibling package
dgpoix, which was initially integrated intosimChef. -
Skill and experience of the chef – Just as every chef’s cooking is informed by the handful of cuisines in which they specialize, simulation experiments are motivated by scientific questions from a particular domain. Just as a chef does not have to become an expert knifemaker before cooking their first meal, nor should the domain scientist have to waste time writing boilerplate code to for the computation and documentation of their simulations.
simCheftakes care of the details of running your experiments across the potentially large number of data and method perturbations you care about, freeing up time for you to focus on your scientific question. -
High-quality tools in the kitchen – Our package should be like an excellent chef’s knife or other kitchen essential. If a chef’s knife doesn’t cut straight or isn’t sharpened, then kitchen speed and safety suffers, as does the final presentation.
simChefwon’t cook a good simulation experiment for you, but it will get you there with less effort and higher-quality presentation while helping you follow best-practices like reproducibility with minimal effort on your part. No sharpening required! -
A high-quality meal is possible in almost any environment – While the scale of a delicious meal may be limited by environment, high-quality meals are not only found in the world’s Michelin-starred restaurants but also in home kitchens and street food carts around the world. An effective simulation framework should also be agnostic to environment, and
simChefruns equally well on your laptop as on a high-performance computing cluster. -
Appetizing and approachable presentation – Ultimately, a chef prepares food for a specific audience, and presentation is almost equal in importance to the underlying substance of the meal. However, a chef doesn’t have to build the plate on which they serve their food.
simChefprovides tools to turn your simulation experiment results into effective displays of quantitative information which are populated within preset and customizable R Markdown templates.
Related R packages
Below, we examine the main functionality of a number of existing tools for running reproducible simulation experiments that are currently available on CRAN and have been updated within the last couple of years.
-
batchtoolsimplements abstractions for “problems” (similar to our DGP concept), “algorithms” (Method insimChef), and “experiments”. In addition to shared-memory computation via theparallelandsnowpackages, it also provides a number of utilities for working with high performance computing batch systems such as Slurm and Torque, whichsimChefsupports via thefuture.batchtoolspackage. -
simulatorprovides a similar tidy human-readable framework for performing simulations such as those common in methodological statistics papers.simulatorincludes code for running simulations in parallel, storing simulation outputs, summarizing simulation results with plots and tables, and generating reports, among many other features. -
SimDesignprovides helper functions to define experimental conditions and then pass those experimental conditions to a user-defined data generation function, analysis function, and summary function. The package also provides a number of these functions for the user to choose from. Each experimental condition can be run over many replicates, computing results in parallel via theparallelpackage. -
simhelpersdefines functions to calculate Monte Carlo standard errors of simulation performance metrics, generate skeleton simulation code, and evaluate in parallel across simulation parameters via thefuturepackage. - The
simToolpackage has two main functions:expand_tibble()andeval_tibble(). The former wraps the base R functionexpand.grid()to create a cartesian product of simulation functions and parameters, while the latter evaluates those functions in parallel via theparallelpackage. - The
parSimpackage implements a single function of the same name which allows for parallelization of arbitrary R expressions across replicates and simulation conditions.parSimuses thesnowpackage to setup parallel backends. -
rsimsumis an R implementation of the Stata commandsimsumand provides helper functions for summarizing and visualizing the results of a simulation study.